Absolutely! Let's dive into the "Match Equations to Graphs" game — a fun, interactive way to strengthen your understanding of how mathematical equations translate into visual graphs.
🎯 Game Objective:
Match each given equation to its correct graph based on shape, key features (intercepts, asymptotes, symmetry), and behavior (increasing, decreasing, periodic, etc.).
You’ll be shown 4 equations and 4 graphs. Your job is to pair each equation with the graph it represents.
📌 Step 1: Understand the Types of Functions
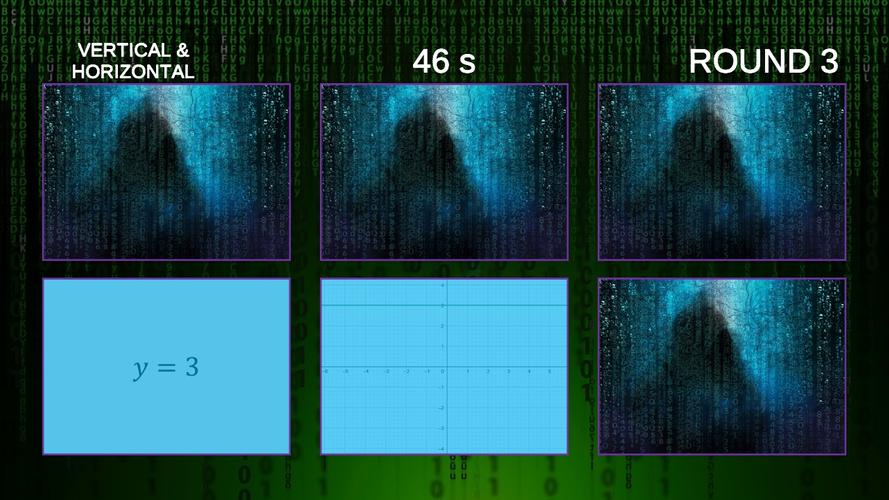
Here are common function types you might see — and what their graphs look like:
| Function Type | General Form | Graph Shape & Key Features |
|---|---|---|
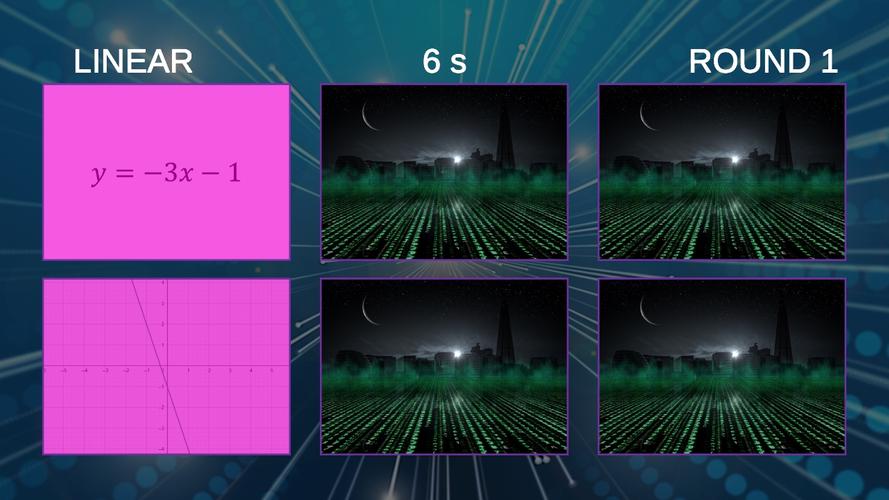
| Linear | $ y = mx + b $ | Straight line; constant slope |
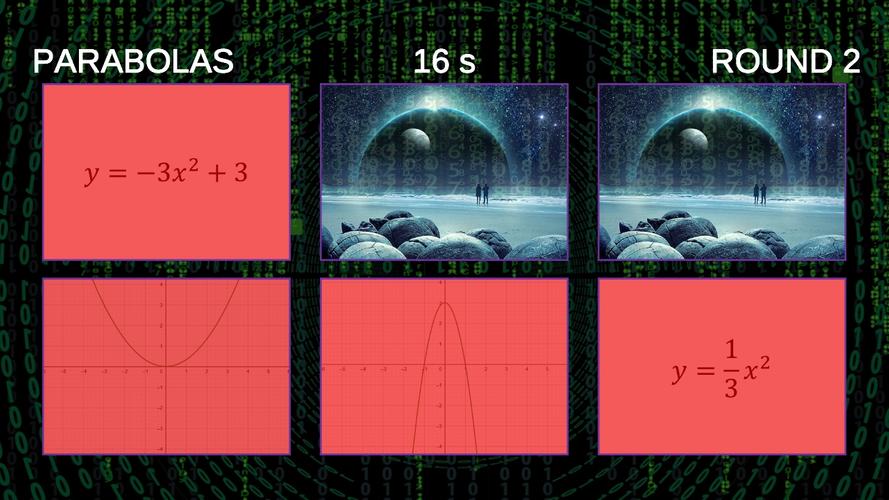
| Quadratic | $ y = ax^2 + bx + c $ | Parabola (U-shaped); vertex, axis of symmetry |
| Exponential | $ y = a \cdot b^x $ | Grows/decays rapidly; passes through (0, a), horizontal asymptote at y=0 |
| Trigonometric (Sine) | $ y = \sin(x) $ | Wave pattern; period = $ 2\pi $, amplitude = 1 |
| Absolute Value | $ y = | x |
| Cubic | $ y = x^3 $ | S-shaped curve; passes through origin, odd symmetry |
🎮 Let’s Play the Game!
Below are 4 equations and 4 graphs (described in words since images aren’t available). Match each equation to the correct graph description.
🔢 Equations:
- $ y = 2x + 3 $
- $ y = -x^2 + 4 $
- $ y = 3^x $
- $ y = \sin(x) $
🖼️ Graph Descriptions:
Graph A: A straight line that goes up from left to right, crossing the y-axis at 3 and the x-axis at $-1.5$.
Graph B: A U-shaped curve opening downward, with vertex at (0, 4), and x-intercepts at $ x = -2 $ and $ x = 2 $.
Graph C: A curve that starts near y = 0 on the left, rises quickly to the right, passes through (0,1) and (1,3), with a horizontal asymptote at y = 0 on the left.
Graph D: A wave that repeats every $ 2\pi $ units, oscillating between -1 and 1, passing through (0,0), $ (\pi/2, 1) $, and $ (\pi, 0) $.
✅ Now, Match Them!
Let’s analyze each equation and find its matching graph.
1. $ y = 2x + 3 $
- This is a linear equation.
- Slope = 2 (upward), y-intercept = 3.
- Crosses y-axis at (0,3), and x-axis when $ 2x + 3 = 0 $ → $ x = -1.5 $.
- Matches Graph A (straight line, up to right, crosses y-axis at 3).
✅ Answer 1 → Graph A
2. $ y = -x^2 + 4 $
- This is a quadratic equation.
- Coefficient of $ x^2 $ is negative → parabola opens downward.
- Vertex at (0, 4) — highest point.
- x-intercepts: $ -x^2 + 4 = 0 $ → $ x^2 = 4 $ → $ x = \pm2 $
- So it crosses x-axis at $(-2,0)$ and $(2,0)$, vertex at (0,4).
- Matches Graph B (U-shaped, but opens downward, vertex at (0,4)).
✅ Answer 2 → Graph B
3. $ y = 3^x $
- Exponential growth.
- As $ x \to -\infty $, $ y \to 0 $ (horizontal asymptote at y=0).
- Passes through (0,1), (1,3), (2,9), etc.
- Grows rapidly to the right.
- Matches Graph C (curve starts low, rises fast, asymptote on left).
✅ Answer 3 → Graph C
4. $ y = \sin(x) $
- Sinusoidal wave.
- Period: $ 2\pi $
- Oscillates between -1 and 1.
- Passes through (0,0), $ (\pi/2, 1) $, $ (\pi, 0) $, $ (3\pi/2, -1) $, etc.
- Matches Graph D (wave pattern, repeats every $ 2\pi $, amplitude 1).
✅ Answer 4 → Graph D
🏆 Final Answers:
| Equation | Matches Graph |
|---|---|
| 1. $ y = 2x + 3 $ | A |
| 2. $ y = -x^2 + 4 $ | B |
| 3. $ y = 3^x $ | C |
| 4. $ y = \sin(x) $ | D |
🎉 Great job! You’ve successfully matched equations to graphs.
🔍 Why This Matters:
- You now recognize how the structure of an equation determines its graph’s shape and behavior.
- This skill is used in science, engineering, finance, and even video game design!
- It helps you predict how a system behaves (e.g., population growth, sound waves, motion).
🔄 Challenge Yourself Next!
Try this version:
Now, draw the graph of $ y = -2\sin(x) + 1 $ — think about amplitude, reflection, and vertical shift.
Or, go one level deeper:
Can you match equations like $ y = 2\sin(3x) $ or $ y = e^{-x} $ to their graphs?
Let me know — I’ll create a new round for you!
🧮 Ready to level up? Let’s go!